Formulas for AP Statistics Exam Preparation

Formulas for AP Statistics Exam Preparation

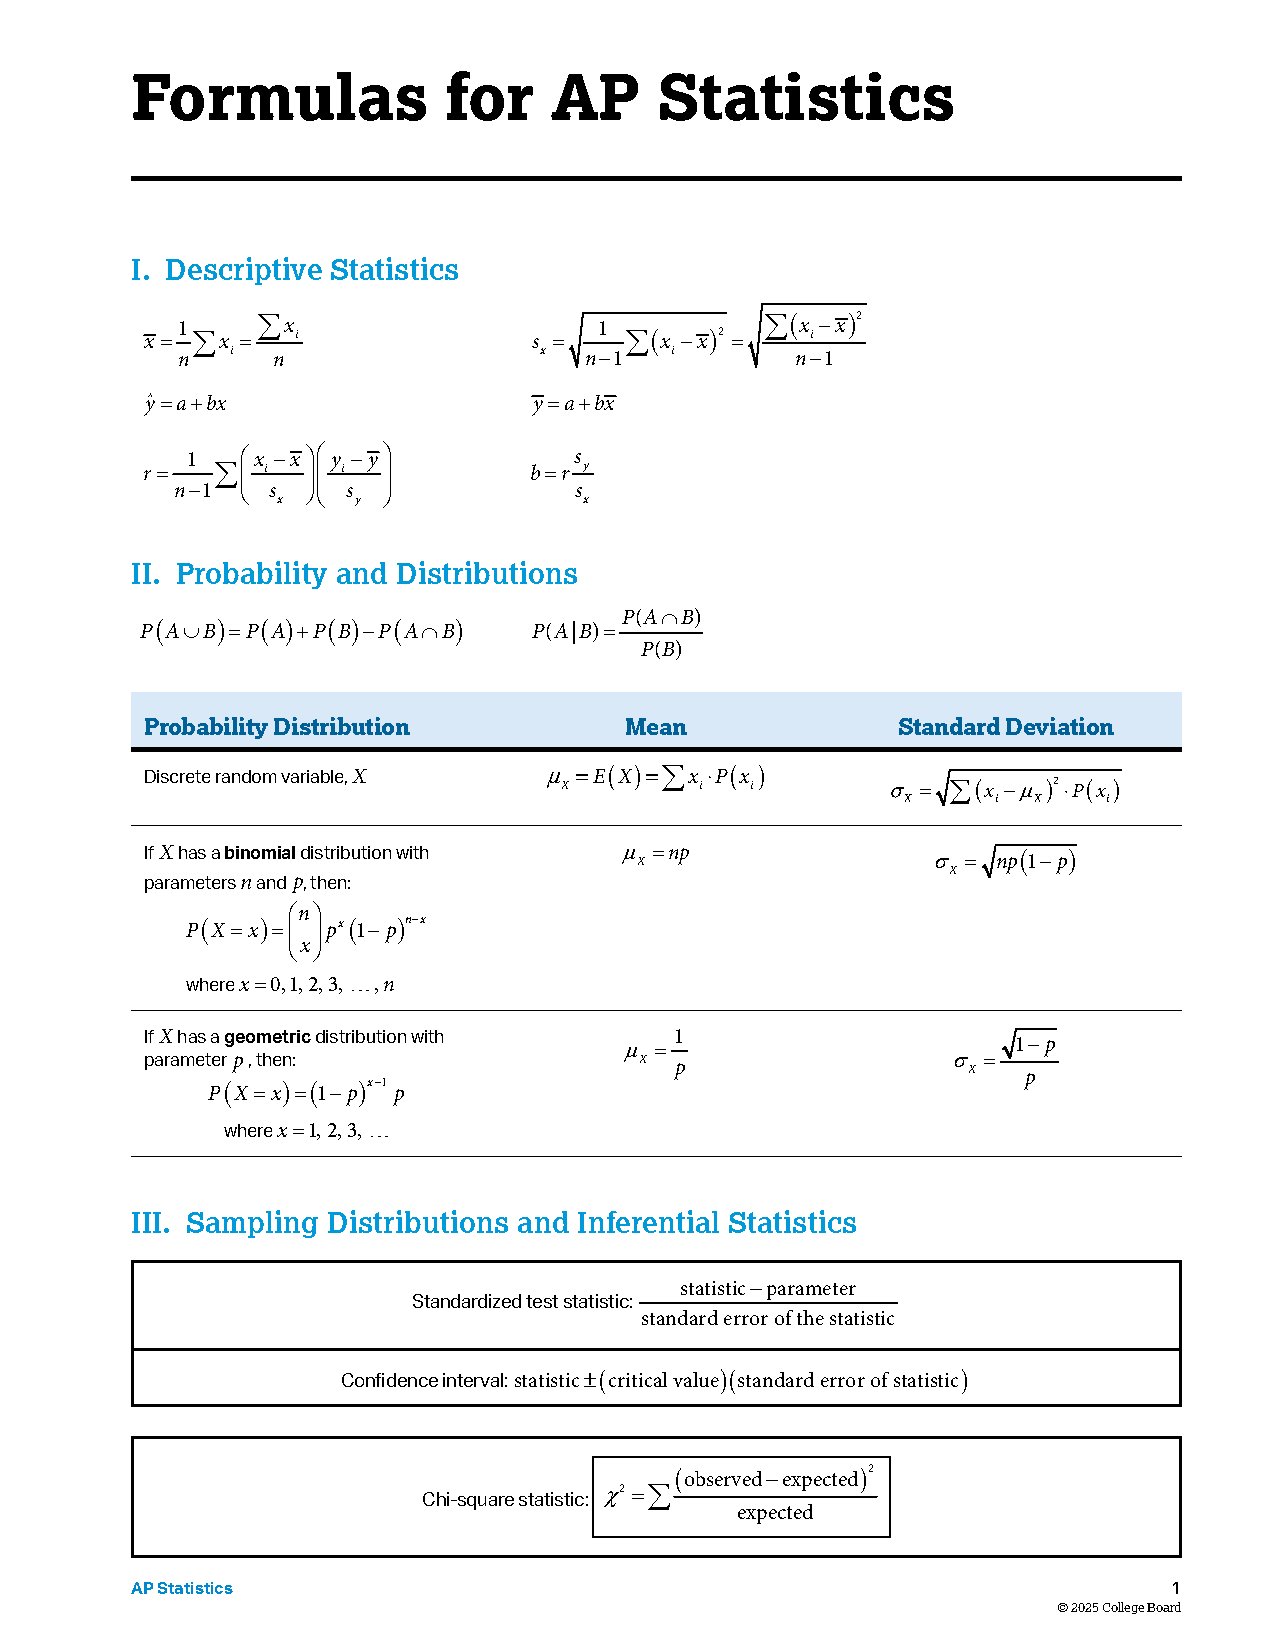
AP Statistics formulas provide essential tools for students preparing for the AP exam. Covering key topics such as descriptive statistics, probability distributions, and inferential statistics, this resource is designed for high school students aiming to excel in their AP Statistics course. It includes standardized test statistics, confidence intervals, and chi-square tests, making it a comprehensive guide for mastering statistical concepts. Ideal for students looking to reinforce their understanding and improve their exam performance.

Key Points

  • Includes formulas for descriptive statistics, such as mean, median, and mode.
  • Covers probability distributions, including binomial and geometric distributions.
  • Explains sampling distributions and inferential statistics concepts.
  • Provides critical values for z-scores and t-scores for hypothesis testing.
267
/ 10
Formulas for AP Statistics
I. Descriptive Statistics
1
i
i
x
xx
nn


2
2
1
11
i
xi
x x
s xx
nn


ˆ
y a bx
y a bx
1
1
ii
xy
x x yy
r
n ss








y
x
s
br
s
II. Probability and Distributions

PA B PA PB PA B
()
(|)
()
PA B
PAB
PB
Probability Distribution Mean Standard Deviation
Discrete random variable,
X
μ
X
=E
()
X=⋅
x
ii
Px
()
σμ
X
=
(
x
)
2
iX
−⋅Px
(
i
)
If
X
has a binomial distribution with
parameters
n and
p
, then:

n
PX x p
x

1 p
nx


x
where
x 0, 1, 2, 3, , n
X
np
X
np

1 p
If
X
has a geometric distribution with
parameter
p
, then:
PX
x

1 p
x1
p
where
x 1,2 ,3 ,
1
X
p
1
X
p
p
III. Sampling Distributions and Inferential Statistics
Standardized test statistic:
statistic parameter
standard error of the statistic
Confidence interval:
statistic ±
(
critical value
)(
standard error of statistic
)
Chi-square statistic:
()
2
2
observed expected
expected
χ
=
© 2025 College Board
1AP Statistics
III. Sampling Distributions and Inferential Statistics (continued)
Sampling distributions for proportions:
Random Variable Parameters of Sampling Distribution
Standard Error* of
Sample Statistic
For one population:
p
ˆ
ˆ
p
p

ˆ
1
p
p p
n

ˆ
ˆˆ
1
p
p p
s
n
For two populations:
p
ˆ
12
p
ˆ
12
ˆˆ
12
pp
p p

12
1 12
ˆˆ
1
1
pp
p pp
n
2

12
1 12 2
ˆˆ
12
ˆ ˆˆ ˆ
11
pp
p pp p
s
nn

When
12
p p
is assumed:
()
12
ˆˆ
12
11
ˆˆ
1
cc
pp
s pp
nn

=− +


where
12
12
ˆ
c
X X
p
nn
2
1p
n
Sampling distributions for means:
Random Variable Parameters of Sampling Distribution
Standard Error* of
Sample Statistic
For one population:
X

X
X
n
s
s
X
n
For two populations:
X
12
X
22
12

XX
12
12
X
12
X
nn
12
12
22
12
12
XX
ss
s
nn
Sampling distributions for simple linear regression:
Random Variable Parameters of Sampling Distribution
Standard Error* of
Sample Statistic
For slope:
b
b
b
x
n
,
where

2
i
x
x x
n
1
b
x
s
s
sn
,
where

2
2
ii
yy
s
n
and

2
1
i
x
x x
s
n
*Standard deviation is a measurement of variability from the theoretical population. Standard error is the estimate of the standard deviation. If the standard
deviation of the statistic is assumed to be known, then the standard deviation should be used instead of the standard error.
© 2025 College Board
2AP Statistics
Tables for AP Statistics
Table entry for z is the probability lying below z.
Table A Standard Normal Probabilities
z
.00 .01 .02 .03 .04 .05 .06 .07 .08 .09
−3.4 .0003 .0003 .0003 .0003 .0003 .0003 .0003 .0003 .0003 .0002
−3.3 .0005 .0005 .0005 .0004 .0004 .0004 .0004 .0004 .0004 .0003
−3.2 .0007 .0007 .0006 .0006 .0006 .0006 .0006 .0005 .0005 .0005
−3.1 .0010 .0009 .0009 .0009 .0008 .0008 .0008 .0008 .0007 .0007
−3.0 .0013 .0013 .0013 .0012 .0012 .0011 .0011 .0011 .0010 .0010
−2.9 .0019 .0018 .0018 .0017 .0016 .0016 .0015 .0015 .0014 .0014
−2.8 .0026 .0025 .0024 .0023 .0023 .0022 .0021 .0021 .0020 .0019
−2.7 .0035 .0034 .0033 .0032 .0031 .0030 .0029 .0028 .0027 .0026
−2.6 .0047 .0045 .0044 .0043 .0041 .0040 .0039 .0038 .0037 .0036
−2.5 .0062 .0060 .0059 .0057 .0055 .0054 .0052 .0051 .0049 .0048
−2.4 .0082 .0080 .0078 .0075 .0073 .0071 .0069 .0068 .0066 .0064
−2.3 .0107 .0104 .0102 .0099 .0096 .0094 .0091 .0089 .0087 .0084
−2.2 .0139 .0136 .0132 .0129 .0125 .0122 .0119 .0116 .0113 .0110
−2.1 .0179 .0174 .0170 .0166 .0162 .0158 .0154 .0150 .0146 .0143
−2.0 .0228 .0222 .0217 .0212 .0207 .0202 .0197 .0192 .0188 .0183
−1.9 .0287 .0281 .0274 .0268 .0262 .0256 .0250 .0244 .0239 .0233
−1.8 .0359 .0351 .0344 .0336 .0329 .0322 .0314 .0307 .0301 .0294
−1.7 .0446 .0436 .0427 .0418 .0409 .0401 .0392 .0384 .0375 .0367
−1.6 .0548 .0537 .0526 .0516 .0505 .0495 .0485 .0475 .0465 .0455
−1.5 .0668 .0655 .0643 .0630 .0618 .0606 .0594 .0582 .0571 .0559
continued on next page
© 2025 College Board
3AP Statistics
/ 10
End of Document
267
You May Also Like
Faqs of Formulas for AP Statistics Exam Preparation
What are the key formulas for descriptive statistics?
Descriptive statistics formulas include measures of central tendency like mean, median, and mode, as well as measures of variability such as range, variance, and standard deviation. The mean is calculated by summing all data points and dividing by the number of points. The median is the middle value when data is ordered, while the mode is the most frequently occurring value. Understanding these formulas is crucial for summarizing and interpreting data sets effectively.
How do probability distributions apply in AP Statistics?
Probability distributions are fundamental in AP Statistics, particularly the binomial and geometric distributions. The binomial distribution is used for scenarios with two possible outcomes, such as success or failure, and is defined by parameters n (number of trials) and p (probability of success). The geometric distribution models the number of trials until the first success occurs. Mastery of these distributions helps students analyze real-world situations involving chance and uncertainty.
What is the significance of sampling distributions in statistics?
Sampling distributions are crucial for understanding how sample statistics relate to population parameters. They allow statisticians to make inferences about a population based on sample data. The central limit theorem states that as sample size increases, the sampling distribution of the sample mean approaches a normal distribution, regardless of the population's distribution. This concept is vital for hypothesis testing and constructing confidence intervals.
What are critical values in hypothesis testing?
Critical values are threshold points that determine the boundaries for rejecting or failing to reject the null hypothesis in hypothesis testing. They are derived from the standard normal distribution (z-scores) or the t-distribution, depending on the sample size and whether the population standard deviation is known. Understanding how to find and use critical values is essential for conducting valid statistical tests and making informed decisions based on data.