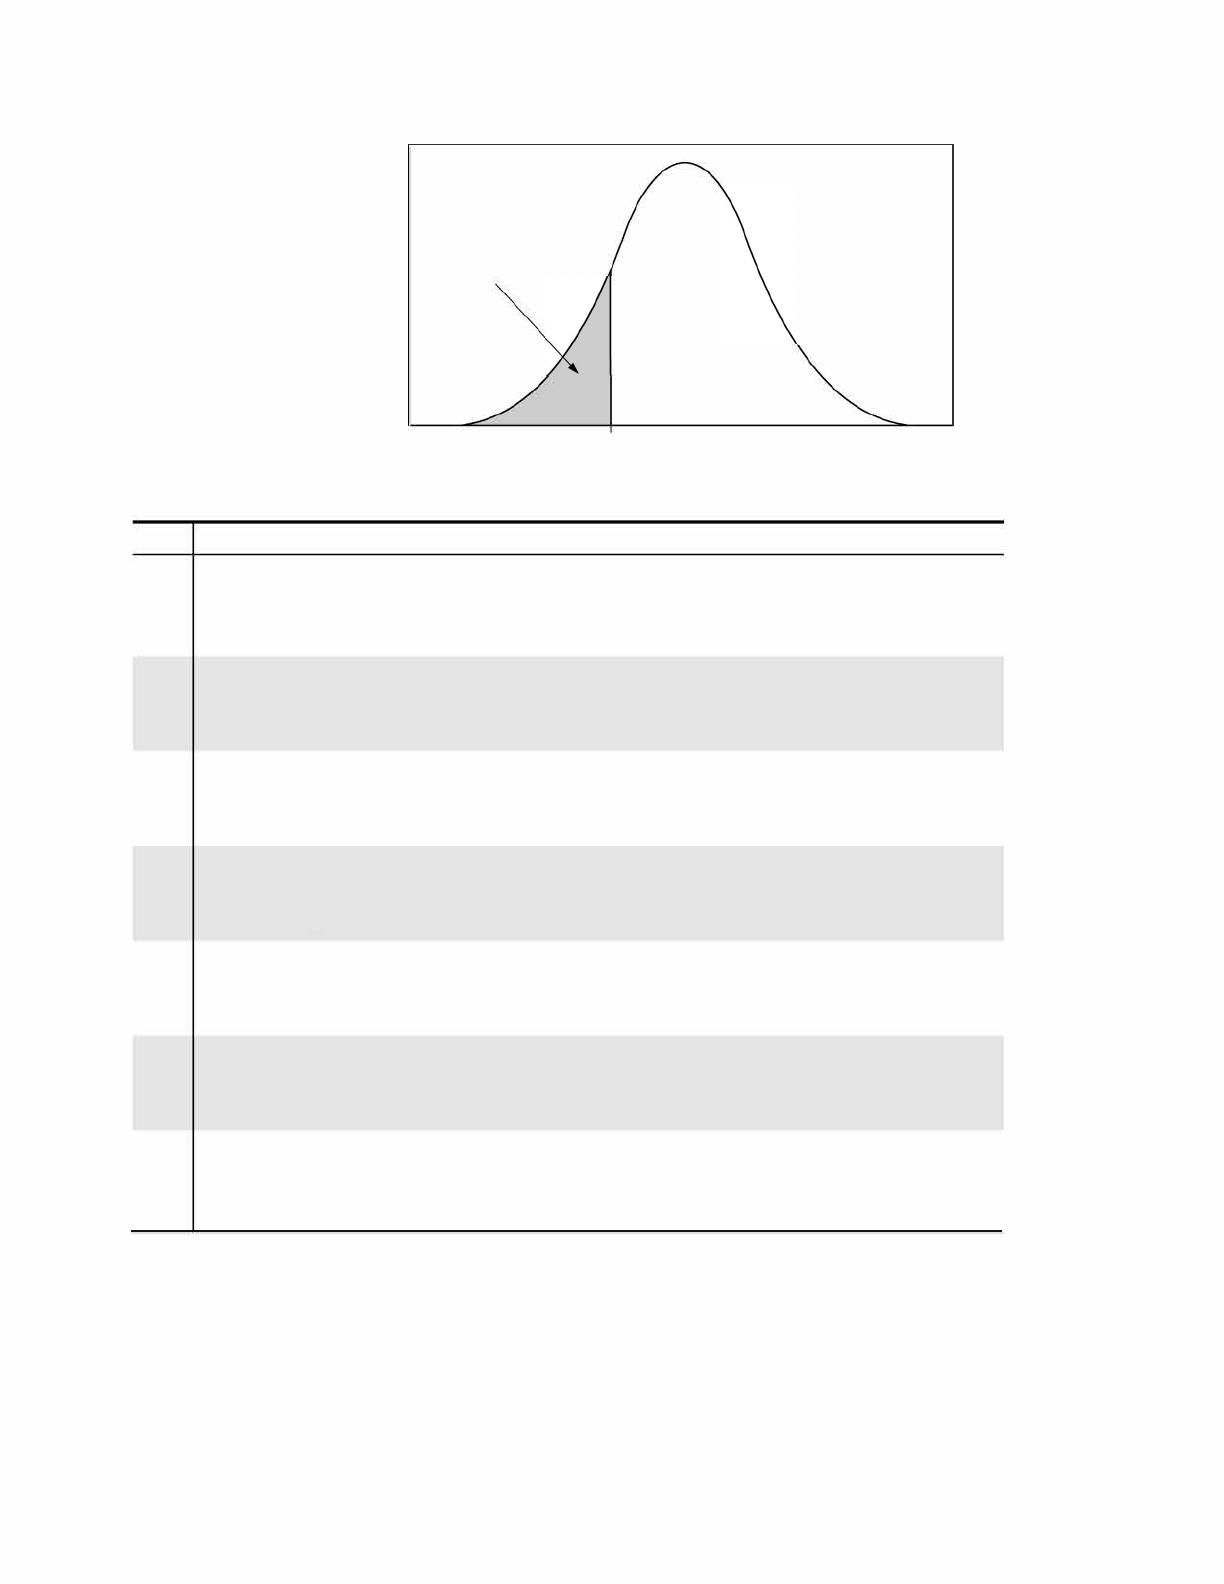
Statistics Formula Sheet and Tables 2020

Statistics Formula Sheet and Tables 2020

The Statistics Formula Sheet and Tables 2020 provides essential formulas and statistical concepts for students and professionals. It includes key topics such as descriptive statistics, probability distributions, and sampling distributions, making it a valuable resource for AP Statistics students preparing for exams. Detailed tables for z-scores, t-distributions, and chi-square critical values are also included, allowing users to quickly reference critical statistical information. This comprehensive guide is perfect for anyone needing to review or apply statistical methods effectively.

Key Points

  • Includes essential formulas for descriptive statistics, probability, and inferential statistics.
  • Features detailed tables for z-scores, t-distribution critical values, and chi-square critical values.
  • Covers sampling distributions for proportions and means, crucial for AP Statistics coursework.
  • Provides standardized test statistics and confidence interval calculations for statistical analysis.
273
/ 6
Formulas and Tables for AP Statistics
I. Descriptive Statistics
1
i
i
x
xx
nn
=∑=
( )
( )
2
2
1
11
i
xi
xx
s xx
nn
∑−
= ∑− =
−−
ˆ
y a bx= +
y a bx= +
1
1
ii
xy
xxyy
r
n ss
−−


=




y
x
br
s
=
s
II. Probability and Distributions
( ) ( ) ( ) ( )
PA B PA PB PA B∪= +
( )
( )
( )
|
PA B
PAB
PB
=
Probability Distribution Mean Standard Deviation
Discrete random variable, X
µ
=
X
E
(
X
)
= xP
i
(
x
)
i
σ
X
=∑−x
iX
Px
i
µ
( )
2
( )
If 𝑋𝑋 has a binomial distribution
with parameters n and p, then:
n
PX
(
= x
)
=
p
x
(
1 p
)
nx
x
where
x= 0, 1, 2, 3, , n
µ
=
X
np
σ
=
X
np
(
1 p
)
If 𝑋𝑋 has a geometric distribution
with parameter p, then:
PX
(
= x
)
=
(
1 p
)
x1
p
where
x = 1, 2, 3,
1
µ
=
X
p
1 p
σ
=
X
p
III. Sampling Distributions and Inferential Statistics
Standardized test statistic:
statistic parameter
standard error of the statistic
Confidence interval:
( )( )
statistic critical value standard error of statistic±
Chi-square statistic:
( )
2
observed expected
expected
χ
=
2
AP Statistics2020 Formulas and Tables Sheet
*S
tandard deviation is a measurement of variability from the theoretical population. Standard error is the estimate of the standard deviation. If the
standard deviation of the statistic is assumed to be known, then the standard deviation should be used instead of the standard error.
III. Sampling Distributions and Inferential Statistics (continued)
Sampling distributions for proportions:
Random
Variable
Parameters of
Sampling Distribution
Standard Error
*
of Sample Statistic
For one
population:
p
ˆ
(
1
)
p
σ
p
ˆ
=
n
µ
p
ˆ
= p
p
p
ˆ
(
1
)
s
p
ˆ
=
n
p
ˆ
For two
populations:
p
1
p
ˆˆ
2
µ
= p
pp
ˆˆ
1
12
p
p
(
1
σ
1
pp
12
) ( )
= +
pp
ˆˆ
12
n
1
p1
2
2
n
2
p
ˆ
s
1
1pp
ˆˆ
12
= +
pp
ˆˆ
12
n
1
(
1
) (
p
ˆ
2
)
n
2
When
p=
1
is assumed:
p
2
s=pp
(
1
ˆˆ
1
pp
ˆˆ
c c
)
12
nn
1
1
+
2
XX
+
p
ˆ
=
1
c
nn
+
where
2
12
Sampling distributions for means:
Random
Variable
Parameters of Sampling Distribution
Standard Error
*
of Sample Statistic
For one
population:
X
µ
=
X
σ
σ
=
X
n
µ
s
s =
X
n
For two
populations:
XX
12
µ
=
µ
XX
1
12
µ
2
σσ
22
σ
=
12
+
XX
12
n
12
n
ss
2
s =
1
+
XX
12
nn
1
2
2
2
Sampling distributions for simple linear regression:
Random
Variable
Parameters of Sampling Distribution
Standard Error
*
of Sample Statistic
For slope:
b
σ
σ
=
b
,
σ
x
n
( )
2
∑−xx
σ
=
i
x
n
where
s
s =
b
,
sn 1
x
(
ˆ
)
2
∑−yy
s =
ii
n
2
( )
2
∑−xx
s =
i
x
n 1
and
where
AP Statistics2020 Formulas and Tables Sheet
b
=
µ
β
Probability
z
fo 

 

 









         
          

         

         

  

 


 

  

 
  




 

 




         












  
  


 


 



   




    






   






 
     


  







 
       
 


 

 



       





 









 










 


  
-1.3


 

 



   

 
   








 

  


 












 



   

  


 


   




  
 




 
 


 








  

 











      
 









 


       
  
AP Statistics2020 Formulas and Tables Sheet
/ 6
End of Document
273
You May Also Like
Faqs of Statistics Formula Sheet and Tables 2020
What are the key components of descriptive statistics in this guide?
Descriptive statistics in the guide include measures of central tendency such as mean, median, and mode, as well as measures of variability like range, variance, and standard deviation. It outlines how to calculate these statistics using provided formulas and examples. Additionally, the guide emphasizes the importance of understanding data distribution and visual representation through histograms and box plots. These components are essential for summarizing and interpreting data effectively.
How does the guide explain probability distributions?
The guide details various probability distributions, including discrete and continuous types, and provides formulas for calculating probabilities. It covers the binomial distribution, geometric distribution, and normal distribution, explaining their parameters and applications. Each distribution is accompanied by examples to illustrate how to use the formulas in real-world scenarios. Understanding these distributions is crucial for making informed decisions based on statistical data.
What sampling distributions are included in the Statistics Formula Sheet?
The Statistics Formula Sheet includes sampling distributions for both proportions and means. For proportions, it outlines the standard error and the mean of the sampling distribution, which are vital for conducting hypothesis tests and constructing confidence intervals. For means, it provides formulas for calculating the standard error and discusses the Central Limit Theorem, which states that the distribution of sample means approaches a normal distribution as sample size increases. These concepts are fundamental for inferential statistics.
What is the significance of the chi-square critical values table?
The chi-square critical values table is significant for conducting chi-square tests, which are used to assess the association between categorical variables. The table provides critical values based on degrees of freedom and significance levels, helping researchers determine whether to reject the null hypothesis. This is crucial in fields such as social sciences and market research, where understanding relationships between variables is essential. The guide explains how to interpret these values in the context of statistical analysis.
How can students use this formula sheet for exam preparation?
Students can use the Statistics Formula Sheet as a quick reference to review essential formulas and concepts before exams. It provides a concise summary of key topics, allowing for efficient study sessions. By practicing problems using the formulas and tables included, students can reinforce their understanding and application of statistical methods. This resource is particularly useful for AP Statistics students who need to familiarize themselves with the types of questions they may encounter on the exam.