AP Statistics Unit 1 Progress Check Free Response Questions

AP Statistics Unit 1 Progress Check Free Response Questions

AP Statistics Unit 1 Progress Check focuses on assessing students' understanding of statistical concepts through free response questions. It includes tasks such as constructing histograms, analyzing distributions, and calculating z-scores for different populations. The content is designed for AP Statistics students preparing for their exams, providing practice in interpreting data and drawing conclusions. This resource helps reinforce key statistical principles and prepares students for the AP exam format.

Key Points

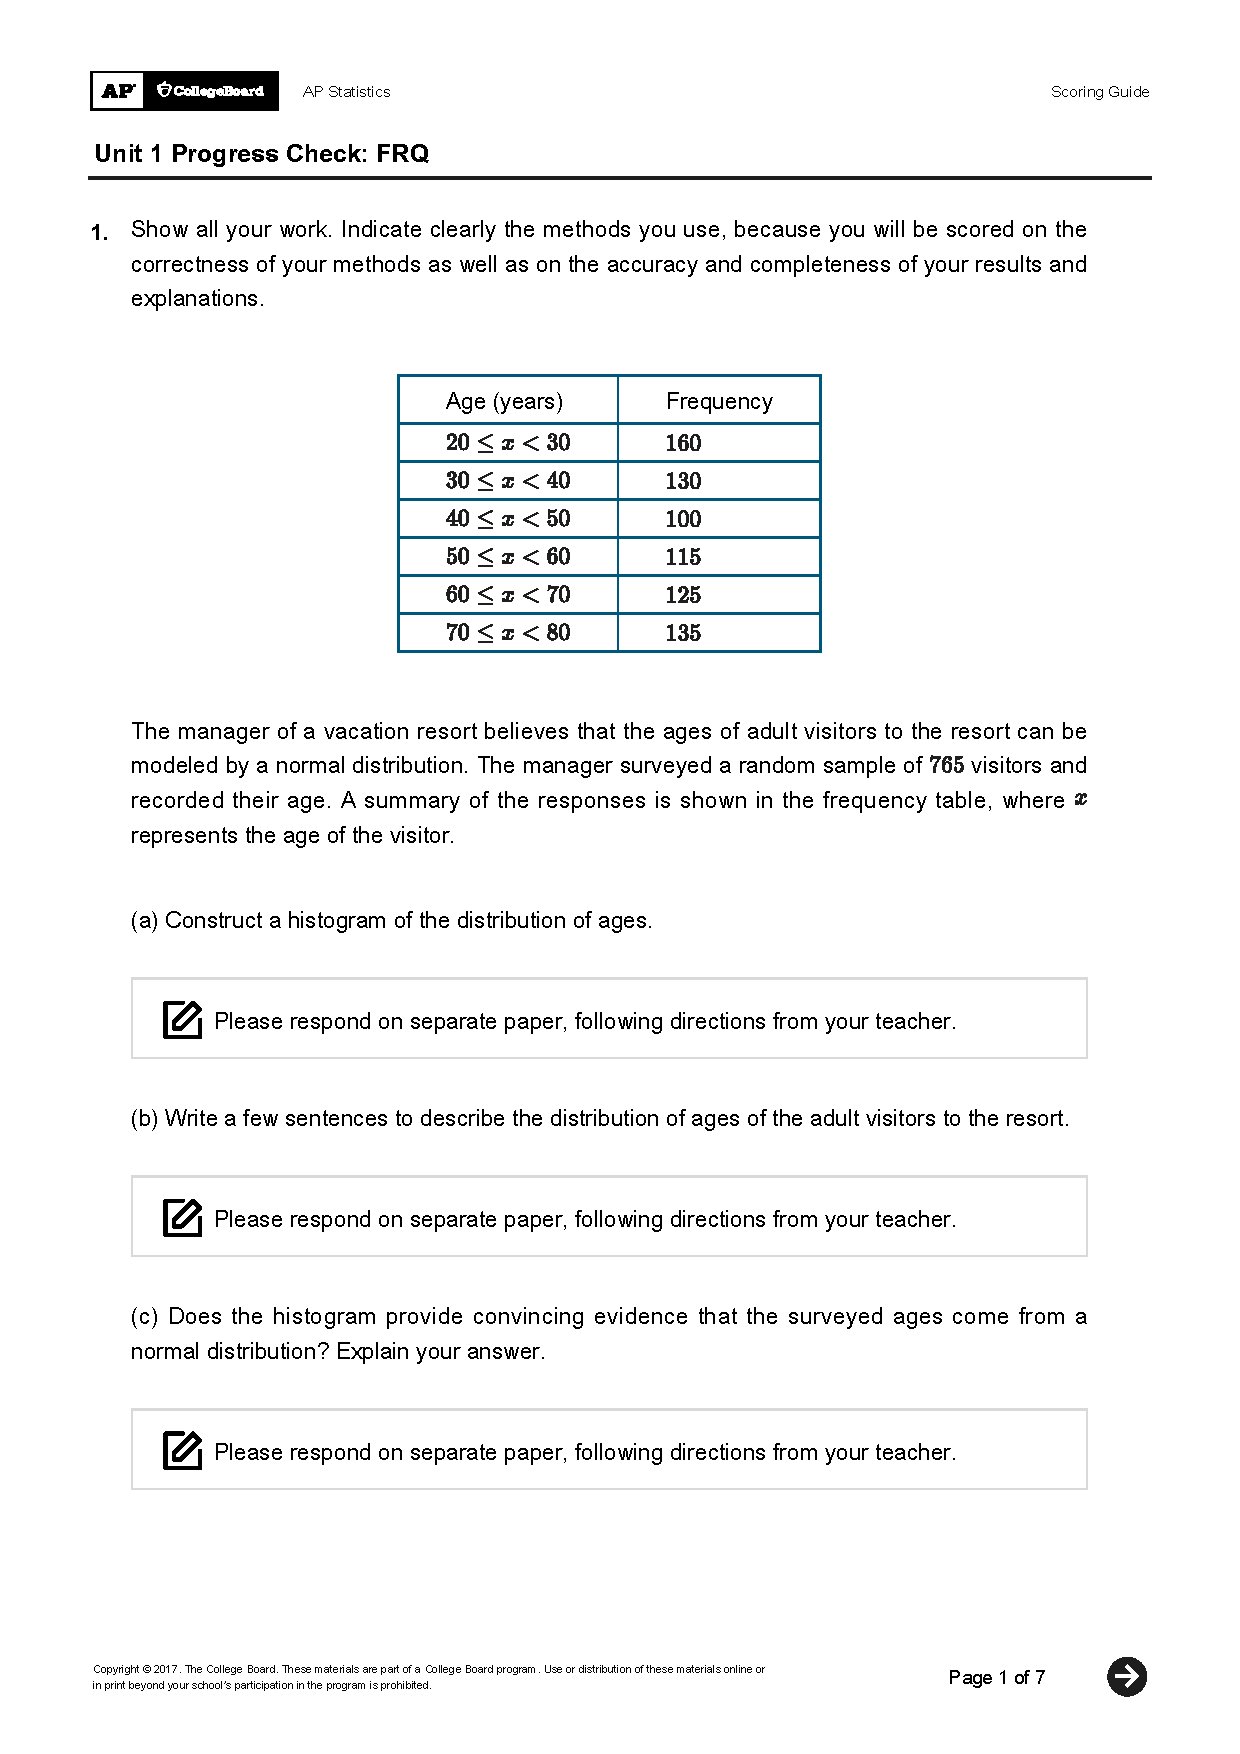
  • Includes free response questions for AP Statistics Unit 1.
  • Covers histogram construction and analysis of age distributions.
  • Features z-score calculations for bird weights in different regions.
  • Encourages students to compare data distributions and normality.
252
/ 7
AP Statistics Scoring Guide
Unit 1 Progress Check: FRQ
Copyright © 2017. The College Board. These materials are part of a College Board program. Use or distribution of these materials online or
in print beyond your school’s participation in the program is prohibited.
Page 1 of 7
1.
Show all your work. Indicate clearly the methods you use, because you will be scored on the
correctness of your methods as well as on the accuracy and completeness of your results and
explanations.
Age (years) Frequency
The manager of a vacation resort believes that the ages of adult visitors to the resort can be
modeled by a normal distribution. The manager surveyed a random sample of visitors and
recorded their age. A summary of the responses is shown in the frequency table, where
represents the age of the visitor.
(a) Construct a histogram of the distribution of ages.
Please respond on separate paper, following directions from your teacher.
(b) Write a few sentences to describe the distribution of ages of the adult visitors to the resort.
Please respond on separate paper, following directions from your teacher.
(c) Does the histogram provide convincing evidence that the surveyed ages come from a
normal distribution? Explain your answer.
Please respond on separate paper, following directions from your teacher.
AP Statistics Scoring Guide
Unit 1 Progress Check: FRQ
Copyright © 2017. The College Board. These materials are part of a College Board program. Use or distribution of these materials online or
in print beyond your school’s participation in the program is prohibited.
Page 2 of 7
Part A, B, and C
The primary goals of this question are to assess a student’s ability to (1) create a histogram to represent
quantitative data graphically; (2) describe a distribution of a quantitative variable; and (3) compare the
resulting graph to a normal distribution.
Scoring
Parts (a), (b), and (c) are each scored as essentially correct (E), partially correct (P), or incorrect (I).
0
1 2 3 4
All three parts essentially correct
Part (a) essentially correct
Part (a) partially correct
Part (a) incorrect
Part (b) essentially correct
Part (b) partially correct
Part (b) incorrect
Part (c) essentially correct
Part (c) partially correct
Part (c) incorrect
Solution
Part (a):
AP Statistics Scoring Guide
Unit 1 Progress Check: FRQ
Copyright © 2017. The College Board. These materials are part of a College Board program. Use or distribution of these materials online or
in print beyond your school’s participation in the program is prohibited.
Page 3 of 7
Scoring
Part (a) is scored as follows.
Essentially correct (E) if the histogram contains six bars with approximately correct values and contains
all four of the following components:
· The horizontal axis is labeled with correct numbers.
· The horizontal axis is labeled with a correct verbal description.
· The vertical axis is labeled with correct numbers.
· The vertical axis is labeled with a correct verbal description.
Partially correct (P) if the histogram contains six bars with approximately correct values and contains two
or three of the following four components:
Incorrect (I) if the response does not satisfy the criteria for E or P
Solution
Part (b): The distribution of ages of the adult visitors to the resort appears to be roughly symmetric. The
distribution has a median between 40 and 50 years. The ages of adult visitors vary from a minimum value
/ 7
End of Document
252
You May Also Like
Faqs of AP Statistics Unit 1 Progress Check Free Response Questions
What types of questions are included in the AP Statistics Unit 1 Progress Check?
The AP Statistics Unit 1 Progress Check includes free response questions that assess students' understanding of key statistical concepts. Students are tasked with constructing histograms, analyzing the shape and center of distributions, and calculating z-scores for specific data points. These questions are designed to test both conceptual understanding and practical application of statistical methods.
How do students analyze the distribution of ages in the AP Statistics Progress Check?
Students analyze the distribution of ages by constructing a histogram based on provided frequency data. They describe the shape, center, and variability of the age distribution, noting features such as symmetry or skewness. Additionally, they evaluate whether the histogram suggests a normal distribution, which involves comparing the observed data to the characteristics of a normal curve.
What is the significance of calculating z-scores in the AP Statistics Progress Check?
Calculating z-scores is significant as it allows students to understand how individual data points relate to the overall distribution. In the context of the AP Statistics Progress Check, students calculate z-scores for bird weights in different regions to determine how likely it is for a bird to exceed a certain weight. This helps students grasp the concept of standard deviations and how they can be used to compare data from different normal distributions.
What statistical concepts are reinforced through the AP Statistics Unit 1 Progress Check?
The AP Statistics Unit 1 Progress Check reinforces several key statistical concepts, including data visualization through histograms, measures of central tendency, and variability. It also emphasizes the importance of normal distribution and z-scores in statistical analysis. By engaging with these concepts, students enhance their analytical skills and prepare for the types of questions they will encounter on the AP exam.